
Related Article
Why Time Viewing Technology will not Work For Military Purposes
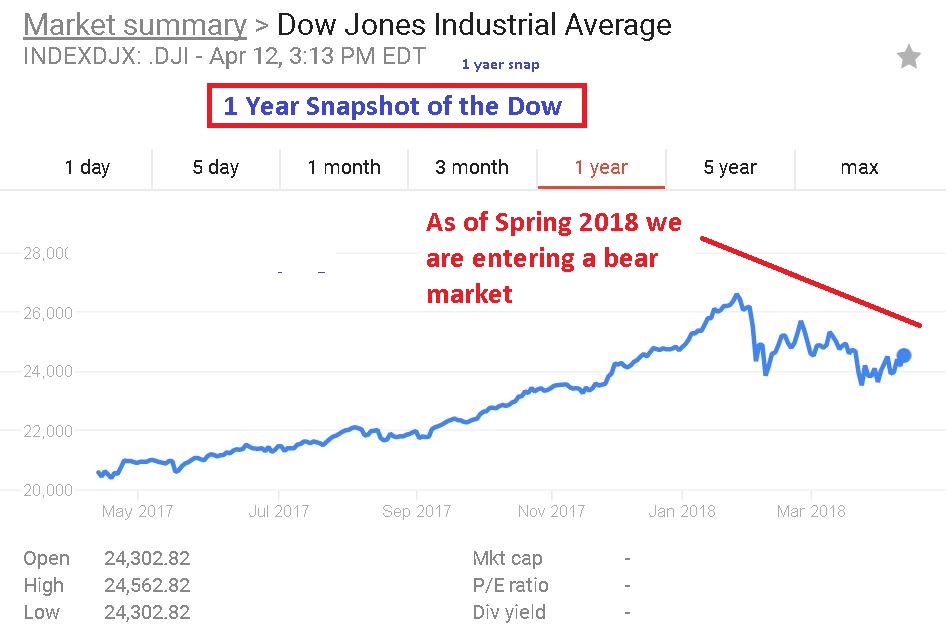
In an article I published back in 2013, I showed that around the years 2016 to 2017 the next great stock market crash would occur. Let us take a look at the current economy today as of Spring 2018.
The Current State of the Economy as of mid 2018
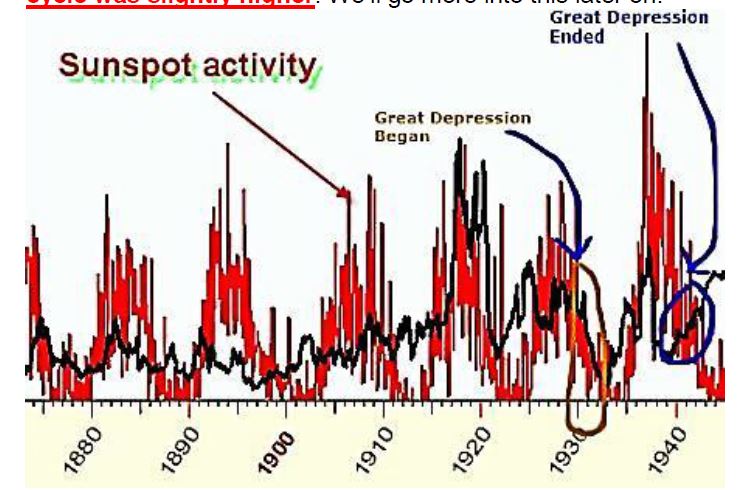
Sunspot Peaks Motivate/Stimulate
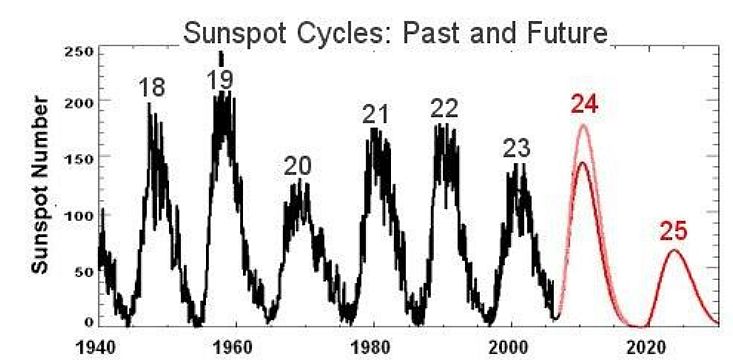
Because increases in sunspots have a motivational/stimulative effect, as the forthcoming sunspot cycle reaches its low, especially when the previous sunspot cycle has been stronger, we get stock market crashes. As the next image shows, the last great depression began at a low of sunspot activity in 1933 and at a period where the sunspot total was less than the previous sunspot total.. We are about to experience another dramatic low starting around 2017 or 2018, peaking to as low as 4.1 sunspots during December 2019. It is also very interesting that the Great Depression ended when the upcoming sunspot cycle was higher/stronger than the previous sunspot cycle. This is a complete reversal of the cause of the markets crashing. That is why we see no major gains in the Dow Jones after the start of 2018 as there is no forecasted sunspot peak occurring for quite a while.
The 2008 Stock Market Crash
To put this more into perspective, if you look at the next image, you will see that we had the 2008 market crash in the United States, which occurred during September when the previous sunspot cycle was higher.
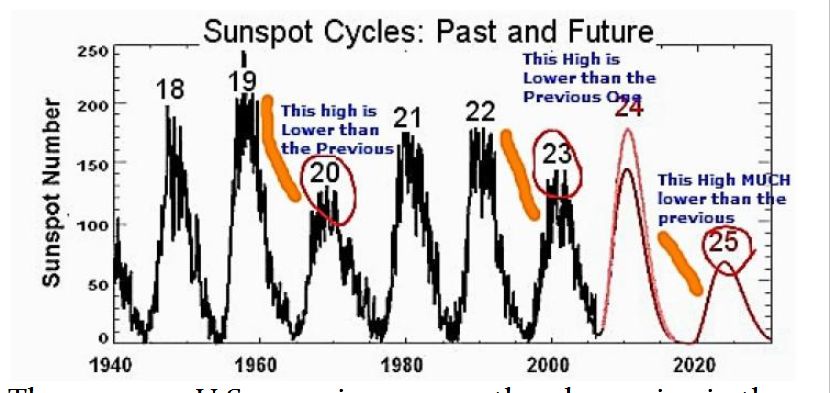
The next low of stock market activity is probably going to take place between the years 2017 to 2019, peaking to as low as 4.1 sunspots during December 2019, according to NASA forecasts. If a crash happens between 2016 and 2017, there will be no major outbreak of violence or mass riots taking place, because it will take place during a Period 4. A time where the energy fueling violence and war turns into peace and rest. The following image shows we have not yet bottomed out of our quiet solar cycle.
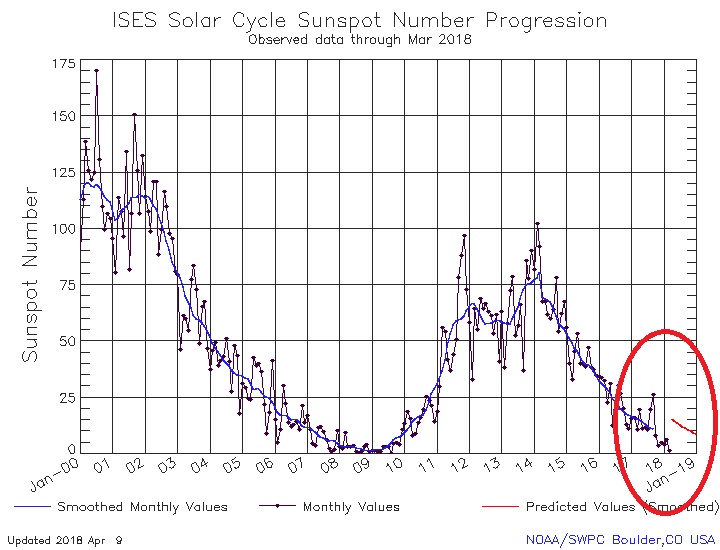
The Market Crash after 2017 and the Possible Coming of a Great War
We are fairly safe from a complete world war until around late 2025. If our calculations are correct, than the next major devastating stock market crash will occur between 2027 and 2030. Sunspot cycle ¦25 is predicted to be extremely low and much lower than the preceding sunspot cycle. This will take place between Period 3 and Period 4. If the crash occurs between 2027 and 2030, which is a Period 3, we could be in for a major global conflict.
Related Article - The Huffington Post - World War III in 2034 -
Let us now review the Tchijevsky periods.
Period 1: - (approximately 3 years, minimum sunspot activity). Peace, lack of unity among the masses, election of conservatives, autocratic, minority rule.
Period 2:- (approx. 2 years, increasing sunspot activity). Increasing mass excitability, new leaders rise, new ideas and challenges to the elite.
Period 3 - (Approximately 3 years, maximum sunspot activity). Maximum excitability, election of liberals or radicals, mass demonstrations, riots, revolutions, wars and resolution of most pressing demands. This period last occurred during 2014.
Period 4 - (Approximately 3 years, decreasing sunspot activity). Decrease in excitability, masses become apathetic, seek peace. This cycle is due to arrive between mid 2017 and early 2018.
If we look at the condition color chart (mini solar cycles) we could expect the great war to break out between the months of July to September.
Upcoming Tchijevsky Periods
Period ¦1 is in 2018 lasting 3 years, ending 2020 to 2021
Period ¦2 is in 2021 lasting 2 years ending in 2022 or 2023
Period ¦3 is in 2023 lasting 3 years ending in 2025 or 2026
PERIOD 3, if it occurs with a worldwide market collapse, COULD BE A TIME OF MAJOR GLOBAL CONFLICT. This is because Period 3 is due to occur around 2030. The telltale sign here is that sunspot cycle ¦25 is much, much lower than that of sunspot ¦24, making it a very, very dangerous time for the markets. Remember as we covered earlier, if the upcoming sunspot cycle is lower than the previous sunspot cycle, the markets are at risk of crashing. And the Tchijevsky Period ¦3 as we showed earlier is a time where wars and revolutions are more common and likely to take place.
Using Sunspot Cycles to Forecast Chaos and Market Turbulence
As we have shown on the EZ website condition colors, make up the “mini solar cycles” that occur during long term sunspot cycles. The average sunspot cycle lasts on average 11 years. The “mini solar cycle” lasts on average between 11 and and 14 days. Let us next look at the Sunspot Cycles and their periods a little more closely.
The Periods of Sunspot Cycles
During World War I, L. Tchijevsky, a Russian professor of Astronomy and Biological Physics who continued his studies at the war front, noticed that particularly severe battles regularly followed each solar flare during the sunspot peak period of 1916-17. Tchijevsky found that fully 80% of the most significant events occurred during the 5 years of maximum sunspot activity. He divided the sunspot cycle into 4 periods with each period representing a set criteria caused by the energy coming from the Solar Period. His Solar Periods are outlined below:
Period 1: - (approximately 3 years, minimum sunspot activity). Peace, lack of unity among the masses, election of conservatives, autocratic, minority rule.
Period 2:- (approx. 2 years, increasing sunspot activity). Increasing mass excitability, new leaders rise, new ideas and challenges to the elite.
Period 3: - (Approximately 3 years, maximum sunspot activity). Maximum excitability, election of liberals or radicals, mass demonstrations, riots, revolutions, wars and resolution of most pressing demands. This is the current period we are in as of 2014.
Period 4: - (Approximately 3 years, decreasing sunspot activity). Decrease in excitability, masses become apathetic, seek peace. This cycle is due to arrive between mid 2014 and 2017.
Below are the Tchijevsky periods linked to the condition color cycles, which when they overlap, show increased energy, as we will show a little later on in this article.

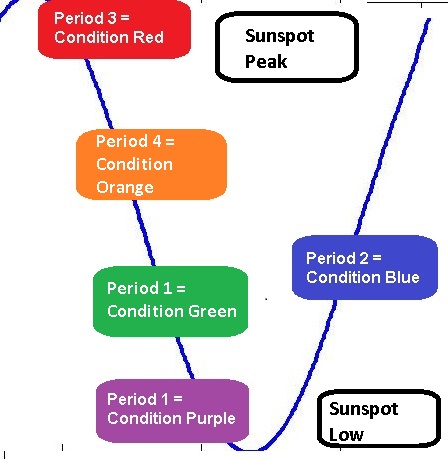
The 11 year Tchijevsky event cycle can be further broken down into the 4 condition colours which make up the “mini solar cycles” developed by Mr. Scott Rauvers of the Solar Institute in Santa Monica, CA. A condition blue begins the cycle, building up energy, followed by a condition red, which is a peak of the energy, which is then followed by a condition orange, then a condition green emerges followed by a condition purple, which is a period of calm.
Using Professor L. Tchijevsky and his cycles from above, we can see that an 11 year sunspot cycle contains within it the “mini solar cycles”.
Period 1 = Condition Purple
Period 2 = Condition Blue
Period 3 = Condition Red to Condition Orange
Period 4 = Condition Green
For illness or pandemic outbreaks, the period shifting from period 3 to period 4 is the most dangerous, as this is when the solar activity suddenly "drops" causing a "shock". The last major event was the Ebola outbreak in 2014 of which you can read more about in our article. Stock market crashes always happen between the condition green and condition purple period, The Tchijevsky periods can be thought of as condition color periods. Therefore, when a condition color (solar mini cycle) overlaps with a Tchijevsky cycle, the effects become intensified.
A summarized review of the Tchijevsky Periods
Period ¦4 began in 2017 lasting 3 years, and ends approximately 2019
Period ¦1 begins approximately during 2019 lasting 3 years, ending approximately 2020 to 2022
Period ¦2 begins approximately in 2021 lasting 2 years approximately ending in 2022 or 2023
Period ¦3 begins approximately n 2023 lasting 3 years ending approximately 2025 or 2026
The next Period ¦4 is forecast around 2026 lasting 3 years, approximately ending between 2028 and 2030
Examining the 2008 Crash
According to the Huffington Post, the biggest drop during 2008 was on September 29, 2008. On this day, the Dow Jones fell a total of 778 points, or 7 percent. Let us see if a condition purple was occurring during this time. As the below image shows, there were 0 sunspots for the previous 6 days.
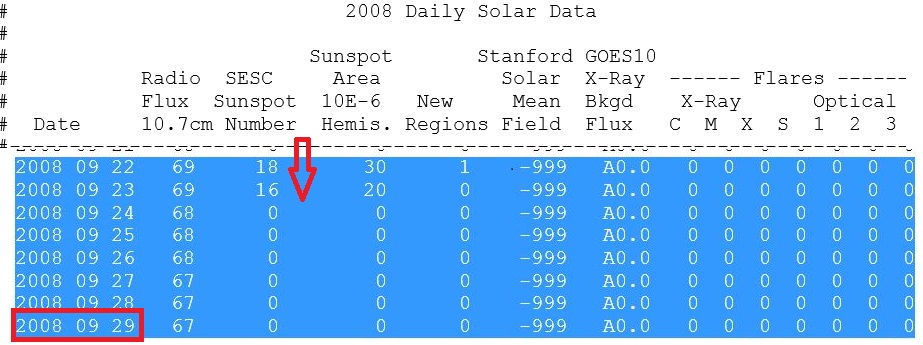
A condition purple is further identified by lower / quiet solar wind speeds. Let us check solar wind speeds on September 29th, 2008. September 29 is the 272nd day of the year. Solar wind speeds had been quiet for a number of days before the crash. Indications of a strong condition purple occurring.

Source: NOAA Historical Solar Weather
http://legacy-www.swpc.noaa.gov/ftpdir/indices/old_indices/2008_DSD.txt
Source:
CalTech Historical Solar Weather
http://www.srl.caltech.edu/ACE/ASC/DATA/level3/mag/magswesummary.cgi?LATEST=0&YEAR=2001&MONTH=9&DAY=11&DOY=-1
Now let us examine the connection between glaucoma and sunspots.

The Connection between Glaucoma and Sunspots
In a research study titled: Association between acute glaucoma and the weather and sunspot activity published in the 1977 British Journal of Ophthalmology, (pages 512 to 516) and conducted by Jeffrey S. Hillman and Jonathan D.C. Turner, the research study concluded that cases of glaucoma peaked during periods of low sunspot activity (Period 4, Condition Purple). The research study found a significant link when the sunspot activity was lower the preceding month and that glaucoma cases showed a higher than average increase in cases. Schorn (1947) also showed that cases of Glaucoma peaked when earth’s geomagnetic activity (KP) was calm. Cycles of calm geomagnetic activity most often occur during periods of low / quiet sunspot activity.
What is most interesting in this study is that this follows the same pattern as stock market crashes, where when the preceding number of sunspots has been higher, as the next sunspot cycle emerges and is of a lower sunspot number, the markets show a tendency to crash more often than usual. So far the outlook for the danger period is between the yeas 2023 and 2025. This window may vary by a fear years depending upon changes in sunspot activity. One important note about period 4, the current period we are now in. One should avoid making hasty and quick decisions and leave more time to make important decisions. By the year 2035 we will be in the next phase of strong stability and much of the danger will have passed. This is because the period we are living in now, which is a period of major change, the changes that are taking place over the next 5 to 7 years are going to set the pace for the period after 2035. Hence we are living in a period of remarkable and major changes.
So in closing, a possible 3rd World War can be avoided as long as we are aware and vigilant of the cycles that could make a worldwide conflict possible. Awareness it the key to altering a potentially bad future and altering destiny to make something better.
All research and discussion concerning the Solar Condition Mini Colors utilized by the Solar Institute should be credited to Mr. Scott Rauvers, the founder of the Solar Institute, Santa Monica, CA.